An intimacy survey describes answers from a particular group. It does not set a target for your relationship, establish what you should enjoy, or predict how a product will feel.
You see a headline saying that “most couples” prefer something. Your first reaction might be curiosity, followed by a less useful question: are we doing things wrong? Before comparing your private life with a percentage, open the source. The useful question is what those people were actually asked.
Reading intimacy surveys means keeping the respondents, question, time period, and result together. A preference poll can offer a conversation starter. It cannot speak for a partner who has not answered that question, and it cannot turn an average into an obligation. Here is a practical way to slow a headline down.
Find the question behind the headline
Start with the original report, rather than a screenshot of its most striking number. Look for the question wording, answer options, number of respondents, recruitment method, and collection dates. If those details are unavailable, keep your conclusion modest. A polished graphic is not a substitute for a methods section.
“Have you ever considered this?” is different from “Did you enjoy this in the past month?” Both might become an enthusiastic headline, although one concerns curiosity and the other a reported experience within a defined period. Neither tells you what every respondent wants now.
Read the answer choices, too. Could people select several options, decline to answer, or choose “not applicable”? An option chosen by the largest group is not necessarily chosen by a majority. Write a plain sentence describing the actual question before deciding what the headline means.
Ask who answered, and who is missing
A poll distributed to a retailer’s mailing list describes a different starting group from a study designed to represent a wider population. Look for age eligibility, location, relationship circumstances, and how people were invited. Do not silently expand “respondents to this survey” into “all adults.”
Check the denominator beside each result. A report may begin with many participants but ask a follow-up question only of a smaller subgroup. A percentage of that subgroup should not be read as a percentage of everyone originally recruited.
NCCIH explains why sample size matters: smaller studies can yield uncertain or chance findings. Still, a large response count does not answer every question about recruitment or relevance. Note both the number and the kind of people included.

Separate a reported preference from a tested effect
A survey asking what people like can describe their answers. It does not, by itself, show that a particular choice caused better health or a stronger relationship. When a headline moves from “people reported” to “this improves,” look for the research needed to support that stronger conclusion.
NCCIH’s guide to research types distinguishes basic research, clinical trials, and reviews of multiple studies. The method should fit the question. An online preference poll and a trial of a defined intervention provide different kinds of information.
Also ask what the researchers measured. Satisfaction with a conversation, interest in buying an item, and a clinical health outcome are separate results. A finding about one should not quietly become a promise about another. Read the authors’ limitations, rather than treating the headline as the complete conclusion.
Read percentages with a starting point
Here is an invented example for arithmetic only, not a finding about intimacy. Suppose 20 out of 100 respondents choose an option in one survey and 30 out of 100 choose it in another. The difference is 10 percentage points. Relative to the first number, the second is 50 percent higher. Both descriptions use the same numbers, but they can feel very different.
Before calling that a trend, you would still need to know whether the groups, questions, and methods were comparable. A changed question or a different audience can make a simple comparison misleading. Keep the original counts when available, and avoid combining unrelated surveys into a story of change.
The Institute for Work & Health’s explanation of risk numbers shows how relative and absolute descriptions can create different impressions. For a health claim, ask for the starting risk, comparison group, and relevant time period. A large-sounding relative change alone is incomplete context.
Use a short headline check
| What you see | What to look for | What remains unanswered |
|---|---|---|
| “Most couples prefer…” | Exact question, response options, and respondent group | What your partner prefers |
| A striking percentage | Counts and denominator, including any subgroup | Whether the result represents other adults |
| “Research shows a benefit” | Method, measured outcome, comparison, and limitations | Whether the claim applies to your circumstances |
| A change over time | Matching questions, recruitment, and collection periods | Whether different methods explain the difference |
Bring a question to the conversation
Instead of “everyone likes this,” try “I read this and wondered what you think.” Leave room for disinterest, uncertainty, or a different preference. Our guide to talking about intimacy offers ways to start without assuming an answer.
You do not need to settle every research question before having an honest conversation. You do need to distinguish a published number from the person in front of you. If an idea goes onto a shared curiosity list, keep it a question rather than a commitment.

Keep a survey separate from a purchase
If a survey makes you curious about a product, return to practical information. Popularity cannot establish suitable dimensions, understandable controls, or care instructions you can follow. Our guide to product features and promises addresses that separate buying decision.
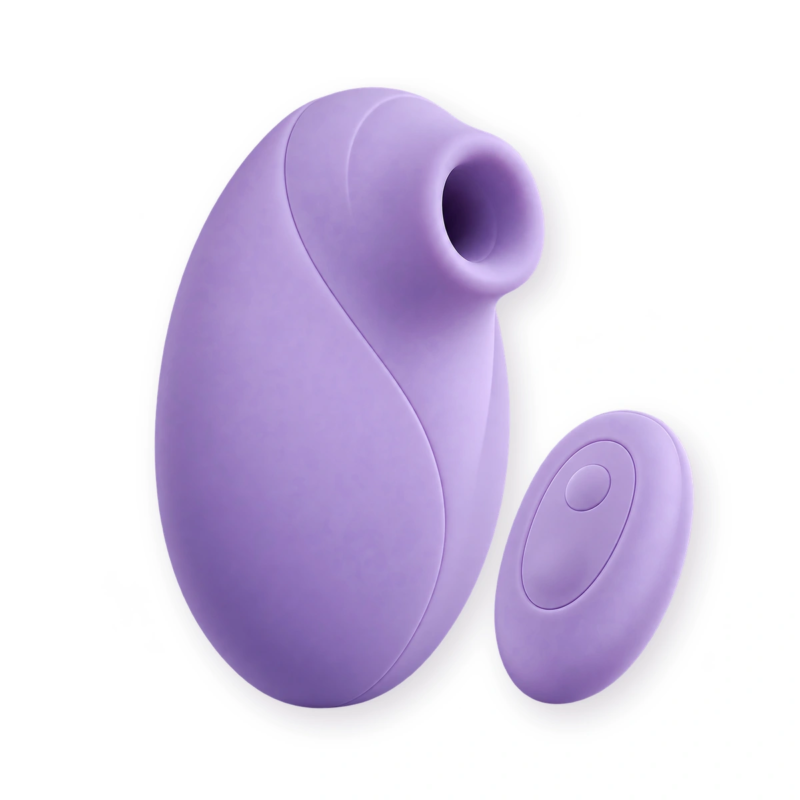
For example, the Compact Remote Vibrating Egg listing describes wireless remote control and rechargeable power. Those details identify features to examine. No preference percentage would tell you whether this particular model fits your priorities, and the card below is not an endorsement by any research source.
If the headline concerns a symptom or treatment, take the original source and your question to a qualified clinician. Our appointment preparation guide can help you organize personal observations. Browse Sex Education for further reading, while keeping your circumstances separate from group averages.
Questions about intimacy surveys
A few checks before turning a number into a personal conclusion.
Does a majority preference mean we should try it?
No. A survey describes answers from its respondents. Your own preferences and a partner’s current answer remain separate; neither person has to match the group.
Is a bigger survey always more trustworthy?
Size matters, but also check recruitment, question wording, response options, and who is included. A large count does not automatically make a sample representative.
Are percentage points the same as a percent increase?
No. In the invented example of 20 rising to 30 out of 100, the difference is 10 percentage points and the relative increase is 50 percent. Always keep the starting numbers.
What if I cannot find the original survey?
Treat the headline as incomplete information. Avoid repeating the number as established fact or using it to make a personal health decision. Look for a traceable source or ask a qualified professional about the actual concern.